One Trade A Day.
Trading Journal That Builds Discipline.
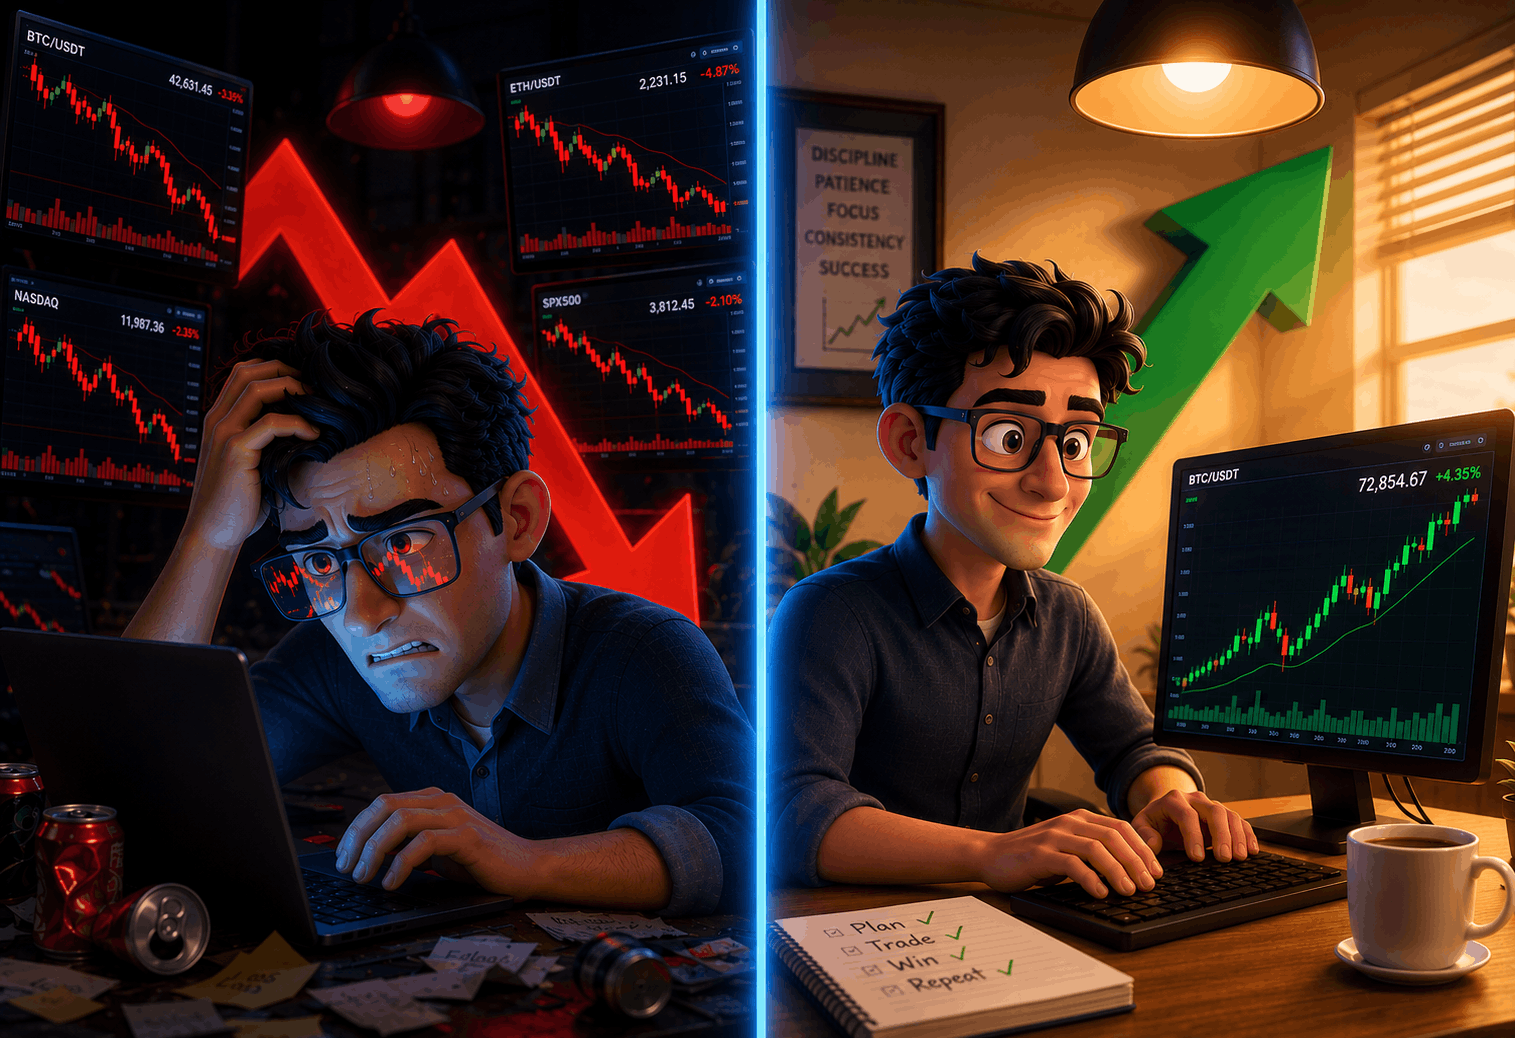
Stop overtrading. Start building the habit that separates profitable traders from the rest.
Trading involves substantial risk of loss. This is a journaling tool, not financial advice. Past performance does not guarantee future results.
A Note to Fellow Traders
After enough time in the market, every trader runs into the part nobody wants to hear: being consistently profitable isn't about the strategy. It's about you.
I chased all of it once. New strategies, paid courses, indicators, every so-called secret setup. None of it fixed my account. What finally did was accepting one simple truth: trading is psychology, not strategy.
Any decent strategy wins often enough when you take the right trade at the right spot. Get the level and the timing right and the odds are already on your side, better than a coin flip. The edge was never a magic system. It's waiting for that one high-probability setup, taking it, and then stepping away.
Most of us don't lose because our strategy is broken. We lose because we overtrade, we revenge trade, and we keep clicking long after our one good trade was already done.
So I built the journal I wish I'd had. One that pushes you to take a single, most-probable trade a day, capture every detail of it, and actually learn from it. The point was never fewer features. It's the discipline to take one good trade and stop.
If you've lost money to the market and you're serious about winning it back, One trade a day is the way. Take your one best trade, then protect your capital and your mind. It starts at $89.99 a year, under $7.50 a month, the cheapest thing you'll ever do for your trading.
Sanju Joseph, Founder
See Every Feature in Action
Reading feature lists is one thing, seeing the actual tool in action is another. Each section below walks you through exactly what a feature does, how it works, and why it matters for your trading.
Built using inputs from
45+ Intraday traders
One trade, one focus
Dashboard Overview
Your dashboard shows win rate, P&L, profit factor, discipline streaks, and a heatmap of your trading activity, all in one place.
Trade Entry
Log your trades with entry, exit, strategy, and how you felt taking the trade. Fast but thorough: captures the full picture in seconds.
Discipline Habits
Consistency score and key trading habit metrics
Score
78%
Impulsive vs Planned Trades
Performance difference between trade types
+$2,840
avg per trade · 68% WR
-$1,920
avg per trade · 26% WR
Stress Level Impact
How stress affects your trading performance
Optimal stress: Medium (4-6), 68% WR
Low (1-3)
52%
28 trades
Medium (4-6)
68%
64 trades
High (7-10)
31%
22 trades
Stress Level →
Entry & Exit Emotions
Distribution and win rates by emotional state
Best Entry Emotion
Calm
71% win rate · 47 trades
Worst Entry Emotion
Revenge
14% win rate · 7 trades
Win Rate by Entry Emotion
Confidence Calibration
How well your confidence predicts actual outcomes
Calibration: Slightly Overconfident- 3 overconfident trades
Low (1-3)
42%
24 · Avg -180
Medium (4-6)
61%
58 · Avg +1340
High (7-10)
48%
31 · Avg -220
Confidence →
Calibration gap: +6.0pp
Behaviour AnalysisPaid
Dive deeper into the psychology behind your trades. See how emotions like fear, greed, and overconfidence actually impact your results.
Performance Analytics
Comprehensive performance metrics broken down by strategy, timeframe, market condition, and risk-reward to show you exactly where your edge lies.
Patterns detected from your last 30 trades
Strong Monday Performance
72%Your win rate on Mondays is 72%
FOMO Trading Alert
28%Trades entered with "FOMO" emotion have 28% win rate
Weak Post-Lunch Performance
36%36% win rate during 1:00–2:30 PM window
VWAP Bounce Edge
68%VWAP bounce strategy yields 68% win rate
Ask questions about your trading in plain English
Why am I losing on BTC after the London close?

Your BTC trades after the London close run a 36% win rate across 14 trades, vs 61% during London hours. Three issues stand out:
- 9 of 14 tagged FOMO or revenge in notes
- Avg loss $640, 2.4x your normal size
- Stop loss missing on 6 of 14 trades
Stop trading BTC after the London close for a week and re-test.
What's my best setup on ES futures?
Ask Your JournalPaid
Ask your journal anything in plain English. It reads your entire trade history and spots patterns you'd never catch manually.
Was my entry on this NIFTY long good? I'm up 60 pts but worried about exiting too early.
Looking at your last 50 trades, your entry here is actually well-timed. You bought the VWAP retest, which is your highest win-rate setup (72% on NIFTY).
But here's the leak: you've exited 60% of your winners early in the last 30 days. Avg missed continuation = $420/trade.
My take
Trail SL to entry once you're +1R. Don't cap the upside on your best setup.
What were you feeling at +60 pts, anxious to lock in?
Educational only · Not financial advice
247 trades analyzed
Trading MentorPaid
Upload a chart, and your Trading Mentor gives you real-time feedback on your setups, entries, and exits, across forex, crypto, futures and stocks.
Session performance, volatility regime & market health
Options positioning skewed bearish. Retail aggressively long while institutions build shorts, classic divergence.
Retail Trap Detected
Retail long +11.6% while FII short +14.2%, distribution underway.
| Segment | FII | PRO | Retail | DII |
|---|---|---|---|---|
| Index Futures | -42.1K -8.4K | +18.2K +3.1K | +24.6K +5.8K | -700 -200 |
| Stock Futures | +1.62L +12.3K | -48.2K -2.4K | -1.15L -9.9K | +600 0 |
| Index Opt CE | -86.2K -14.2K | +32.4K +6.1K | +53.4K +8.6K | +400 +100 |
| Index Opt PE | +64.8K +9.8K | -22.6K -3.8K | -42.1K -6.2K | -100 0 |
| Index Fut L/S | 0.58 | 1.42 | 1.86 | 0.97 |
Market IntelligencePaid
Real-time market data, participant open interest analysis, FII/DII activity, and market health indicators, all inside your journal.
April 2026
Monthly P&L View
Total P&L
+$42,850
Profitable Month
Win Rate
75.0%
Strong
Best Day
+$6,400
14 Apr
Worst Day
-$2,100
7 Apr
Trading Calendar
A visual heat map of every trading day, green for profits, red for losses. Spot winning streaks, slumps, and your most active periods instantly.
Why One Trade Per Day?
The most profitable traders aren't the busiest ones. They're the most selective. We built OneTradeJournal around a counterintuitive truth: trading less can improve your discipline.
Overtrading is the #1 Account Killer
Study after study finds the vast majority of active retail traders lose money, not from bad analysis, but from trading too often. More trades = more fees, more emotional decisions, more losses.
One Perfect Setup > Ten Mediocre Ones
When you commit to one trade, you stop chasing every candle. You wait for YOUR setup. The one that matches your edge. That's when real growth happens.
Discipline is a Muscle: Train It Daily
The market tests your patience every second. One trade per day builds the mental muscle to sit on your hands when others are revenge trading.
Protect Your Capital, Protect Your Mind
Every trade you don't take is a loss you didn't suffer. Fewer trades means less drawdown, less stress, and more mental clarity for the trades that matter.
Focus Creates Mastery
Instead of scattered attention across 10 trades, pour all your analysis into one. Review it deeply. Learn from it completely. That's how experts are made.
Small Consistent Wins Compound
Small, consistent gains add up over time. You don't need home runs. You need singles, consistently, with discipline. That's the power of compounding good habits.
Everything You Need to Trade Better
16 purpose-built tools for disciplined traders across forex, crypto, futures and stocks. Track your trades, understand your psychology, find your edge, and build the discipline that turns analysis into profit.
Simple Trade Entry
Log the one trade you took today by hand in under 30 seconds. Capture entry, exit, P&L, strategy tag, why you took it, and how you felt. Writing it yourself is what makes the habit stick: smart defaults keep it fast, not a 20-field chore.
Trading MentorPaid
A personal coach that has read every single trade you've ever logged. Ask it why you lose on Monday mornings, or what your best setup is, and get answers grounded in your actual data, not generic advice.
Chart AnnotationsPaid
Mark your entry, exit, stop loss, and target directly on chart screenshots. Add notes explaining your thought process so future-you can understand exactly why you took the trade.
Pattern DetectionPaid
After 20+ trades, the system starts surfacing patterns you can't see yourself, like "your VWAP breakout trades on Mondays have an 85% win rate" or "you lose 3x more when you trade before 9:30 AM."
Ask Your JournalPaid
Type questions in plain English and get instant answers from your own trading data. "What's my win rate shorting EUR/USD?" "Which strategy made me the most last month?" No filters to configure: just ask.
Performance Analytics
Win rate, profit factor, Sharpe ratio, max drawdown, R-multiple distribution, and more, broken down by strategy, instrument, timeframe, and market condition. Know exactly where your edge comes from.
Exit Efficiency
Most traders exit too early or too late. Exit efficiency measures how much of the available move you captured on each trade, so you can tell if you're consistently leaving money on the table.
Missed Trade Tracker
Log the setups you spotted but didn't take. Track what would have happened, calculate the opportunity cost, and build the conviction to pull the trigger next time your edge shows up.
Strategy Playbook
Document your strategies with clear entry rules, exit criteria, position sizing, and ideal market conditions. The system auto-tracks performance per strategy so you can see what actually works, not what you think works.
Market ContextPaid
See how you perform across forex sessions (London, New York, Asia), volatility regimes, and market conditions, all inside your journal. Correlate market context with your own results without switching between apps.
Pre-Trade ChecklistPaid
Before you enter a trade, the checklist reviews your recent history and flags risks, like "your win rate drops to 28% when you feel anxious" or "you've already hit your daily loss limit." A guardrail against impulsive trades.
Trading Calendar
A visual heat map of every trading day: green for profits, red for losses, intensity shows magnitude. Spot streaks, slumps, and patterns at a glance. See your best and worst weeks instantly.
Share Your Trades
Generate clean, professional trade cards showing your setup, result, and key stats. Share to Twitter/X or trading groups with auto-generated captions: build your trading brand while staying accountable.
Trade History
Your complete trading log with powerful filters: search by instrument, strategy, emotion, date range, or P&L outcome. Sort, filter, and bulk-edit trades. Export to CSV anytime, your data always belongs to you.
Smart AnalysisPaid
Get a weekly and monthly breakdown of your trading behaviour: recurring mistakes, your best setups, emotional triggers, and specific areas to improve. Personalized insights that get sharper the more you trade.
Affordable Pricing
Free to journal and analyse your trades. Paid plans unlock AI features, from $11.99/month, $24.99/quarter, or $89.99/year internationally (₹399 / ₹999 / ₹2,499 for India). 154+ free trading tools are open to everyone.
Know Your Numbers
Most traders rely on gut feeling to judge their performance. These analytics replace intuition with hard data, showing you exactly where your edge comes from, where you're leaking money, and what to focus on to improve your bottom line.
+$25,400
+18.2%
Equity Curve Tracking
Watch your account value grow (or dip) over time with a visual equity curve. Instantly spot drawdown periods, recovery times, and whether your overall trajectory is trending in the right direction.
Strategy Performance
See each strategy's win rate, total P&L, and trade count side by side. Know exactly which setups are making you money and which ones are dragging your account down, then allocate your focus accordingly.
Best window
14:30 - 15:30 · 74% win rate
Time-Based Analysis
Break down your win rate by time of day to discover your optimal trading window. Many traders find they perform dramatically better (or worse) during specific market hours, and this data makes that visible.
Avg Winner
2.4R
Avg Loser
0.8R
Risk-Reward Analysis
Visualize your actual risk-reward distribution across all trades. See how many trades fall below 1:1, how many hit 2:1 or better, and whether your R:R is improving over time as you refine your entries and exits.
Symbol Performance
Compare your performance across different instruments: BTC, EUR/USD, individual stocks. See which symbols give you the highest win rate and P&L, and which ones consistently cost you money.
Leaving ~$1,520/trade on the table. Trail SL after +1R.
Exit Efficiency
Measures the percentage of the available price move you actually captured. If a trade moved $4,000 and you took $2,600, that's 65% efficiency. Track this over time to see if you're improving at holding winners.
Master Your Psychology
Your emotions drive your decisions. Track how you feel, identify patterns in your mistakes, and build the discipline that separates profitable traders from the rest.
Confident & calm states give 2.5x better results than emotional ones.
Emotion-Performance Link
Every trade you log includes your emotional state. Over time, this builds a clear picture of how fear, greed, FOMO, and overconfidence directly impact your P&L, with hard numbers, not guesswork.
+6 vs last week
Stuck to plan on 4 of 5 days. Keep it up.
Weekly Trend
Avg 76
Discipline Scoring
A daily discipline score calculated from whether you followed your plan, respected your stop loss, sized your position correctly, and stuck to one trade. Track your discipline trend over weeks and months.
Exited early
12 occurrences · 30% of losses
-$8,400
No stop loss
8 occurrences · 22% of losses
-$6,200
Averaged down
6 occurrences · 21% of losses
-$5,800
First 15 min
9 occurrences · 15% of losses
-$4,100
Overtrading
4 occurrences · 12% of losses
-$3,600
Mistake Pattern DetectionPaid
Surfaces your costliest recurring mistakes, like "moving stop losses has cost you $2,480 this month" or "your revenge trades after a loss have a 15% win rate." Shows you exactly what to fix first for maximum impact.
Habit Building
Track consecutive days of disciplined journaling with a visual streak counter. Every day you log a trade and complete your review, the streak grows. Miss a day, it resets. Simple gamification that builds the daily habit serious traders need.
Possible Tilt Detected
Step away for 30 min. Your win rate drops 52% in this state.
Tilt DetectionPaid
Analyzes your recent trading patterns, rapid entries, increasing position sizes after losses, deviation from your plan, and warns you when you're showing signs of emotional tilt. Knowing when to step away can save you more than any strategy.
Win rate drops 40% when anxious
Pre-Trade Checklist
Before you enter any trade, a personalized checklist reviews your historical data and flags risks specific to you. If your win rate drops when anxious, or if you've already hit your loss limit today, you'll see the warning before you click buy.
Which Trader Are You?
OneTradeJournal is built for traders ready to stop chasing candles and start compounding discipline.
The Overtrader
10+ trades a day. Still not profitable.
Setups everywhere. Impulse entries. Revenge trades after every loss. By the day's close, you're exhausted - and your account is bleeding. One-trade-a-day forces patience. Wait for YOUR setup. Miss the noise.
The Part-Time Trader
Full-time job. Part-time edge.
You can't stare at charts all day - and you don't want to. One focused trade during the hours you have is enough. Pre-market planning, market-hours execution, post-market reflection - a routine that fits around real life.

The Aspiring Pro
Read every book. Still not consistent.
You've spent years on strategy - courses, indicators, backtests. But results don't compound. The gap isn't your setup, it's execution. Build the discipline first. Profits follow from there, not the other way around.

The Prop-Firm Trader
Forex, futures, crypto - you trade a funded account.
Enter your firm's rules, daily loss limit, max drawdown, max trades a day, and get a clear "Can I trade today?" verdict before every session. Track adherence, protect the account, and build the discipline that passes evaluations. No account syncing required.
How It Works
A simple 4-step process to transform your trading discipline.
Signing up and journaling is free. AI reviews come with a paid plan.
Plan Your Trade
Before the market opens, review your watchlist and identify one high-conviction setup. Write down your entry criteria, stop loss, and target. This pre-market ritual forces selectivity: no more impulsive entries.
Execute with Discipline
When your setup triggers, take the trade and log it immediately: entry price, strategy, position size, and how you're feeling. Capturing your emotional state in the moment is what makes this journal different from a spreadsheet.
Exit and Reflect
Close your position based on your pre-defined plan, not on fear or greed. Log your exit, note whether you followed your rules, and write what you learned. This 2-minute reflection is where the real growth happens.
Review & Improve
Over time, your journal builds a complete picture of your trading behaviour. Weekly and monthly reviews surface your best setups, your costliest mistakes, and the emotional patterns that drive your decisions.
How We Compare
See how OneTradeJournal stacks up against other trading journals ($150–600/year), generic AI analytics tools, and your broker app. Built for discipline across forex, crypto, futures & stocks.
Compare against
Discipline Costs Less Than One Bad Trade
Starting at ₹208/month, less than a single revenge trade costs you. No hidden fees, no upsells, all features included.
The journal and analytics are free, forever. These plans unlock AI features and voice input.
Monthly
Try it month to month
billed monthly
- Full journal access
- All AI insights & patterns
- 154+ free trading tools
- Export your journal anytime
- Email support
Quarterly
Commit a little, save a little
₹333/month
- Everything in Monthly
- All AI insights & patterns
- Save ₹198 vs monthly
- Export your journal anytime
- Email support
Yearly
Best for the disciplined trader
₹208/month
- Everything in Quarterly
- All AI insights & patterns
- Save ₹2,289 vs monthly
- Priority support
Start with Monthly to unlock AI risk-free · Cards & UPI accepted · Billed in ₹, GST included · No hidden fees
Frequently Asked Questions
Get answers to common questions about OneTradeJournal
How much does OneTradeJournal cost?
We offer three plans, Monthly, Quarterly, and Yearly (Yearly saves the most), starting at $11.99/month internationally (₹399/month in India). Every paid plan includes full platform access, behavioral analysis, the discipline score, prop-firm rule tracking, and 135+ free trading tools. Journaling itself is free, forever.
Is there a free trial?
Yes! You can explore the platform and use our 135+ free trading tools without signing up. Once you create an account, you get a trial period to test all premium features.
What payment methods do you accept?
We accept all major credit and debit cards worldwide through our secure payment provider, plus UPI and net banking for India.
Can I cancel my subscription anytime?
Yes, you can cancel anytime. Your access continues until the end of your billing period. All sales are final - please see our Refund Policy for details.
Do smart features cost extra?
Every subscription includes 1,000 credits per month - enough for daily trade analysis, mentoring, chart analysis, and pattern detection. Credits reset each billing cycle. Need more? You can purchase additional credits.
Why one trade per day?
Research shows overtrading is a major cause of losses. By focusing on one quality trade per day, you become more selective and disciplined. Quality over quantity.
Can I log more than one trade per day?
Yes! While we encourage the one-trade discipline, you can log unlimited trades. The platform tracks and highlights your 'One Trade' to help build discipline over time.
How does the daily streak system work?
Your streak tracks consecutive days of journaling. Each day you log at least one trade or journal entry, your streak increases. This gamification helps build consistency in your trading practice.
What is exit efficiency analysis?
Exit efficiency measures how well you time your exits. It calculates the percentage of the available move you captured, helping you understand if you're leaving money on the table.
How does tilt detection work?
Tilt detection looks at your recent trading behaviour - rapid entries, increasing position sizes after losses, deviation from your trading plan, and emotional state logs. When these indicators suggest you're trading emotionally, it flags a warning before you enter your next trade. Many traders find this alone pays for the subscription.
Can I import my trades from my broker?
No, and that's deliberate. OneTradeJournal is built to build a habit and strengthen your trading psychology, which only works when you log each trade yourself, while it's fresh. Bulk import skips the reflection that creates the edge. You start from scratch and grow from your next trade.
Do I really have to enter every trade manually?
Yes, and it takes under a minute. A trade is just entry, exit, quantity, and a few words on your reasoning and emotion. That small daily act of writing it down is what keeps you honest and present - it's the habit the platform is built to grow.
Can I export my journal data?
Yes, you can export all your trades and journal data in CSV format anytime. Your data belongs to you, and you can take it with you if you ever decide to leave.
Is my trading data secure?
Absolutely. We use bank-level encryption (AES-256) to protect your data. Your information is never shared with third parties, and we don't have access to your brokerage accounts.
Do you connect to my broker account?
No, never. We don't connect to your broker, and we don't ask for any login credentials. You log your trades by hand, so your brokerage account stays completely separate and secure.
How does the Trading Mentor work?
The Trading Mentor analyzes YOUR trading history to give personalized advice. Ask questions like 'Why do I lose on Thursdays?' and get insights based on your actual trades.
What is Pattern Detection?
Our system scans your trade history to find winning and losing patterns you might have missed - like 'Your VWAP trades on Mondays have 85% win rate' or 'You lose more when anxious'.
Can it analyze my chart screenshots?
Yes! Upload your chart screenshots and get analysis of entry/exit points, pattern identification, improvement suggestions, and visual trade reviews.
What is 'Ask Your Journal'?
It's natural language querying for your trades. Ask questions like 'What's my best strategy?' or 'Show my Monday vs Friday performance' and get instant answers with stats.
How accurate is the analysis?
Insights are based on your actual trading data. The more trades you log, the more accurate and personalized the analysis becomes. Always use insights as guidance, not financial advice.
How do I get started?
Sign up with your email or Google account, then log the one trade you took today by hand - what you traded, why, and how it ended. Come back tomorrow and do it again. The platform guides you through each step.
Is there a mobile app?
OneTradeJournal is a responsive web app that works great on mobile browsers. Add it to your home screen for an app-like experience. Native apps are on our roadmap.
Can I use it on multiple devices?
Yes! Your account syncs across all devices. Log a trade on your phone, review it on your laptop - everything stays in sync automatically.
Do I need trading experience?
Our platform is designed for all levels. Beginners benefit from the discipline framework and learning resources. Experienced traders appreciate the advanced analytics and smart insights.
Which markets does OneTradeJournal support?
Forex, crypto (spot and perps), US stocks, futures, and options, plus Indian F&O. You pick your markets and the journal, currency, fee models, and analytics adapt: quote-currency P&L for forex, funding costs for crypto perps, session analytics, and more.
Is it good for prop-firm traders?
Yes. You enter your firm's rules, daily loss limit, max drawdown, max trades per day, and OneTradeJournal grades your adherence with a clear 'Can I trade today?' verdict. It's discipline tracking, not account syncing, so it works with any firm.
What about intraday vs swing vs positional?
All of them. Track intraday scalps, swing trades, and positional trades across every market. Filter and analyze your performance by trade type to see what actually works for you.
How do I get help if I'm stuck?
Use the 'Report Issue' or 'Request Feature' buttons in the sidebar, email us directly, or check our learning resources. We typically respond within 24 hours.
Can I request new features?
Yes! We actively listen to user feedback. Use the 'Request Feature' button to submit ideas. Many of our features came directly from user suggestions.
Is there a community or forum?
We're building a community of disciplined traders. Follow us on social media and stay tuned for our upcoming community features like leaderboards and discussion forums.